Feature · Shading
The shading loss for every panel, from the building’s own 3D model.
The designer follows the sun through the year and measures how much of the sky each panel sees. Dormers, chimneys, trees, poles and the building’s own walls cast shade as they stand in the model.
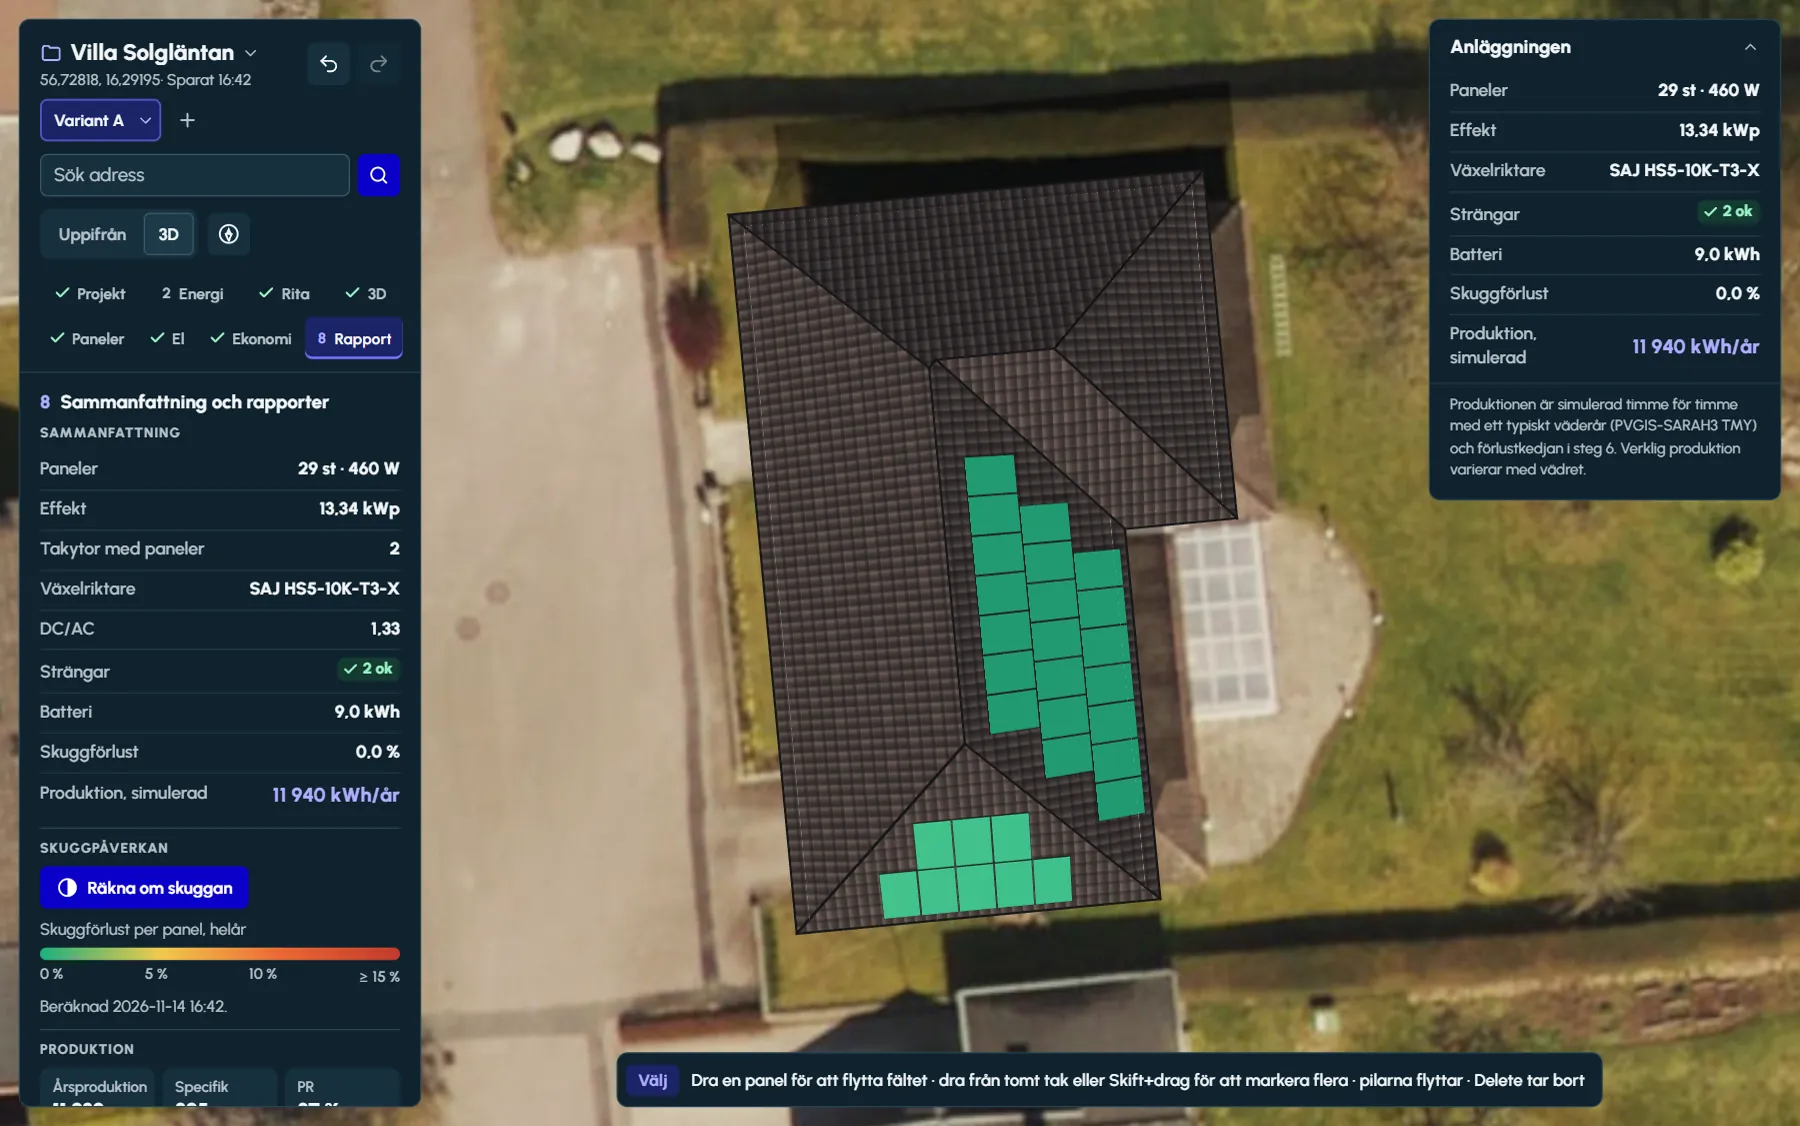
What casts shade
Shading is calculated against what is in the 3D model: the roof and walls of the house, other building parts and the obstacles you add from above in step 3. The obstacles are dormers, chimneys, vents, trees and poles or flagpoles, each with its own height and dimensions. A tree has both a height and a crown radius.
A neighbouring house that casts shade can be drawn as a building part of its own, and then shades just like the house’s own parts. Panels on a pitched roof lie in the plane of the roof and do not shade each other. Rows on racks on a flat roof do, so the row spacing shows up in the loss.
The shading analysis in figures
- 21st
- of every month, every 30 minutes between 03:00 and 21:00 solar time
- 9
- sample points per panel, three by three, close to the panel edges
- 0–15%
- the colour scale: green without shading, yellow at 5%, orange at 10% and red from 15%
Sky view: shading of the diffuse light
A large share of the year’s irradiation comes from the sky, not directly from the sun. So for each sample point the designer works out how much of the sky is visible, weighted by the angle at which the light falls on the panel. A dormer or wall next to the panel takes away both direct sun and a piece of sky, and both are deducted.
The loss per panel is the shaded share of the year’s irradiation – direct sun at the points that lie in shade and the diffuse light from the hidden part of the sky – divided by the panel’s total irradiation over the year.
The irradiance map: the roof face before the panels go on
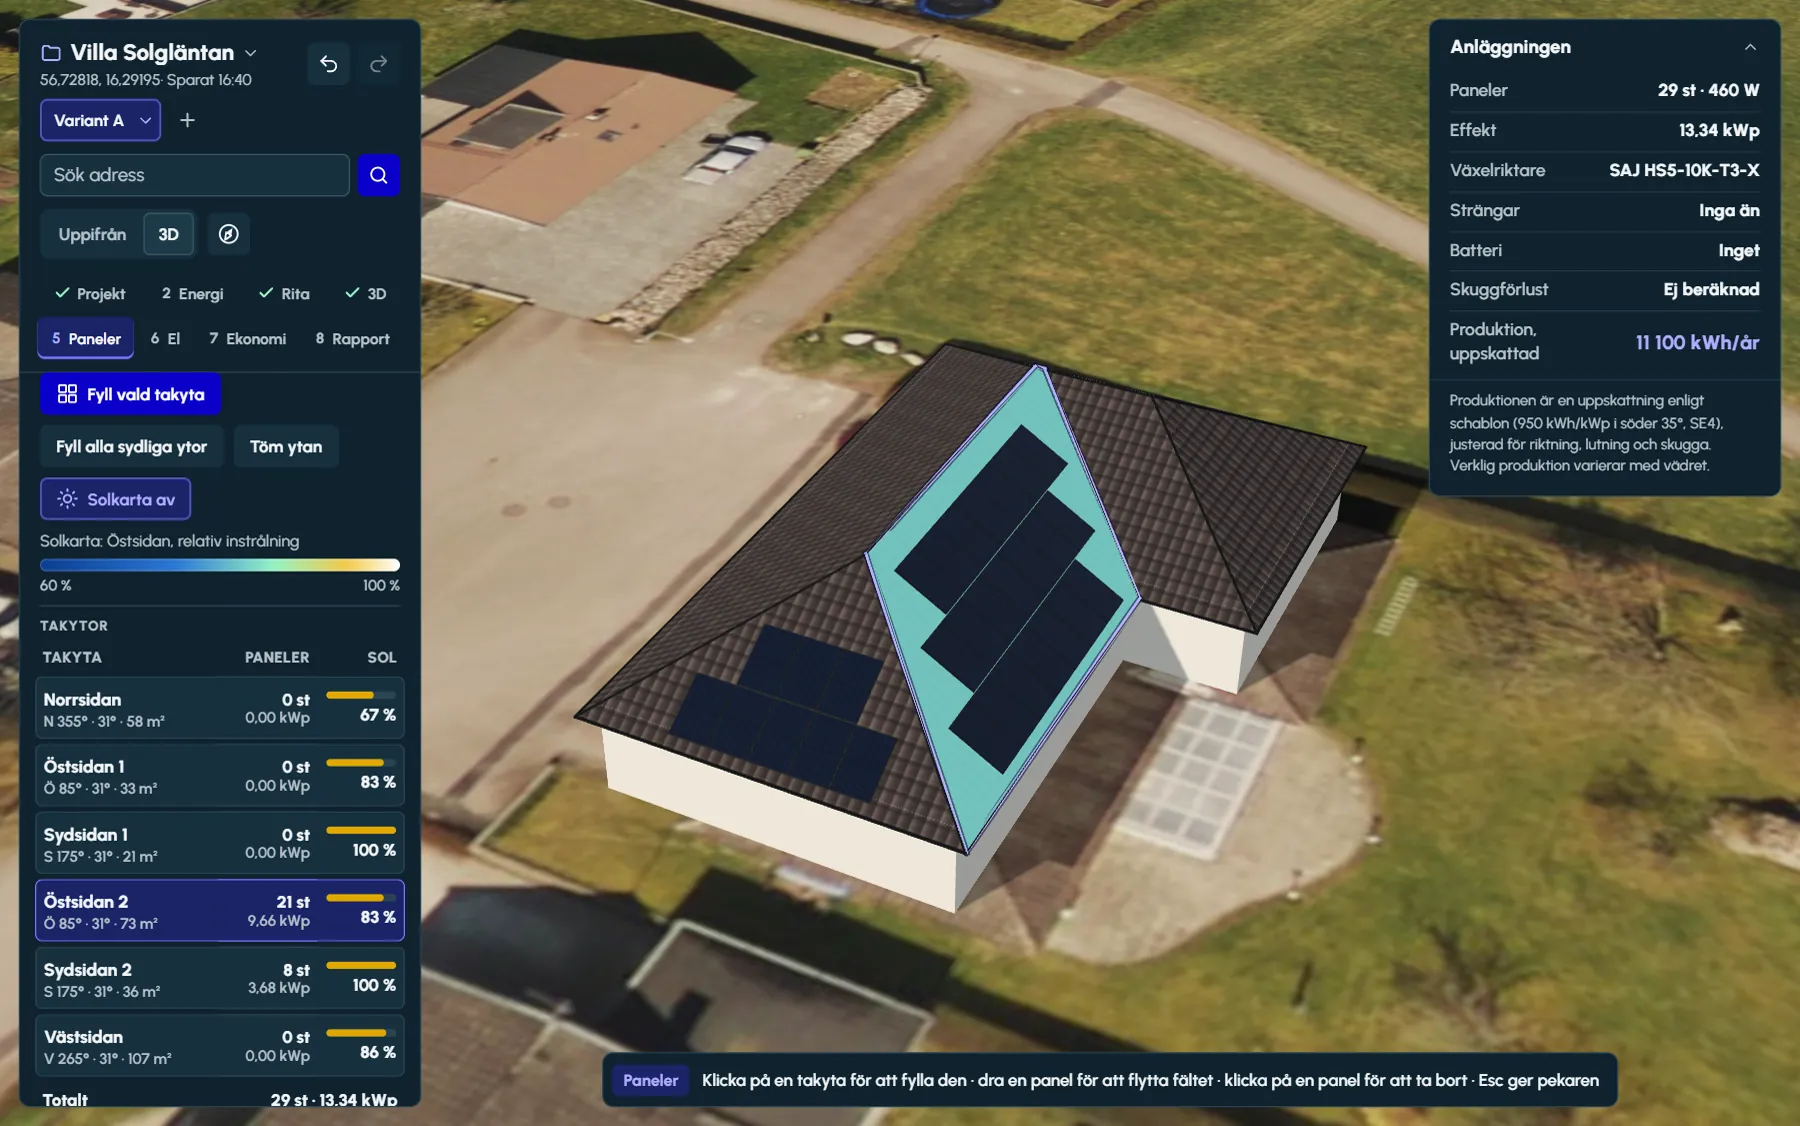
In step 5, Irradiance map on shows how much sun each part of a roof face receives over the year, in cells of 25 × 25 centimetres. The value is relative to an unshaded south-facing surface at a 35 degree pitch, so you see where panels earn the most and where a dormer or chimney takes light.
The map is calculated for every full hour on the 21st of every month, with both direct sun and sky view. No cells are drawn under the footprints of obstacles, since no panels go there.
The shading loss in step 8
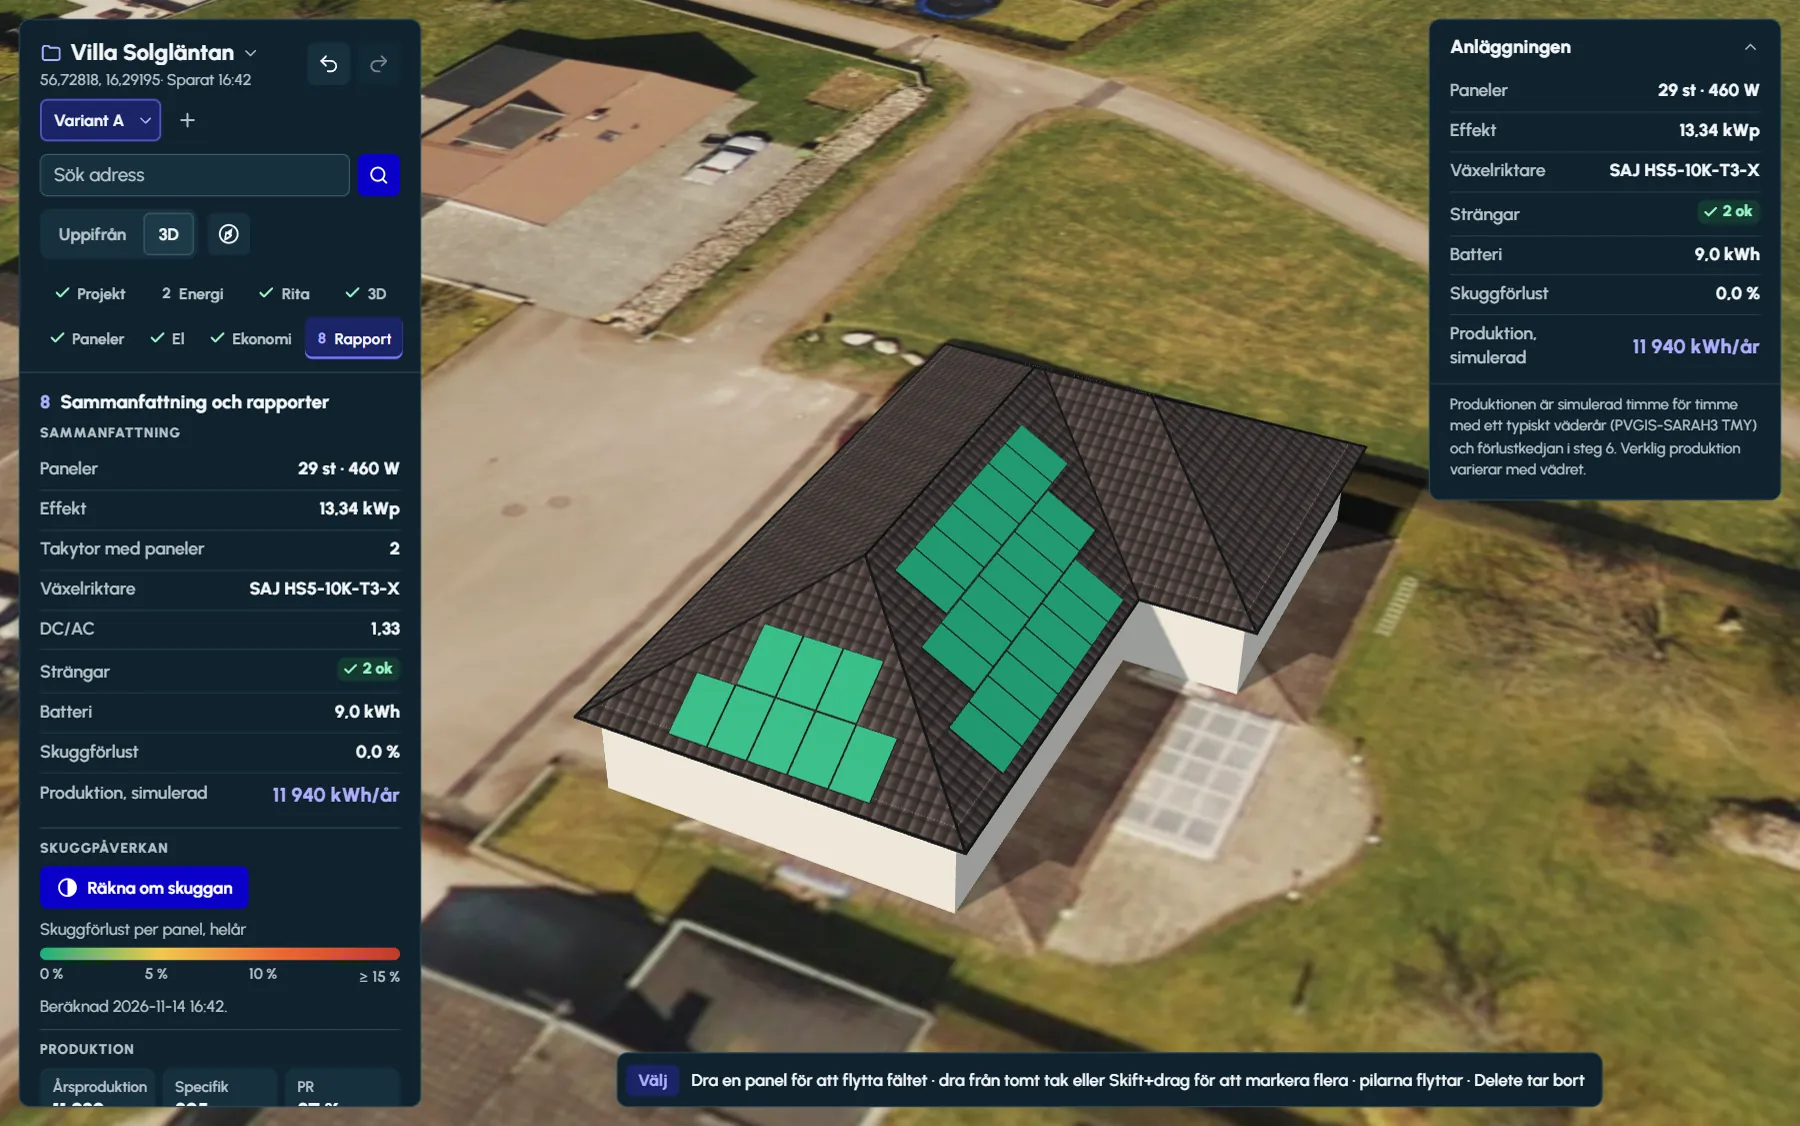
Run shading analysis in step 8 calculates every panel, with a progress bar that can be cancelled. The panels are coloured by their loss and the designer shows the total shading loss over the year. If the roof, the obstacles or the panels change afterwards, the old analysis is removed and the designer tells you to run it again.
When the analysis covers every panel, the loss is deducted from the estimated yield, panel by panel. In the PDF report it becomes a section of its own with the total loss, the most shaded panel and the loss per roof face.
Hour by hour in the simulation
The detailed simulation goes one step further. For each panel, the shading on the panel’s three bypass sections is calculated against a grid of sun positions, and for every hour of the weather year the shading is read from that grid. The terrain horizon from PVGIS blocks the direct sun when it is low.
The string power is then calculated with a simplified model of the panels’ current and voltage, including bypass diodes. A shaded section limits the current or is bypassed, and the string operates at the point that gives the most power. This shows the loss of having a shaded panel in the same string as unshaded ones. With optimisers, each panel is calculated on its own.
Good to know
- Panels are not placed in an obstacle’s clearance margin. The default is 30 cm around a chimney and 20 cm around a vent, and the margin can be changed per obstacle.
- An old shading analysis does not stay on a changed roof. If an obstacle or a panel is moved, the analysis is removed until it is run again.
- Each variant of the design has its own shading analysis, so two layouts on the same roof can be compared.
- Without a shading analysis the panels are treated as unshaded, and the PDF report says so.
Questions and answers
Questions and answers
How many points per panel does the shading analysis calculate?
Nine, in a three-by-three grid that runs close to the panel edges, so that shade creeping in from a nearby dormer or chimney is picked up. The sun’s path is followed on the 21st of every month, every 30 minutes.
Is shading from trees included?
Yes. Trees are added as obstacles from above in step 3, with height and crown radius, and cast shade in 3D like the other obstacles.
Does the analysis take the surrounding terrain into account?
The simulation does: the horizon is fetched from the PVGIS terrain model and blocks the direct sun when the sun is below it. The shading analysis and the irradiance map work with what is in the 3D model.
What do the colours mean?
Green is no shading loss, yellow about 5 per cent, orange 10 per cent and red 15 per cent or more of the panel’s irradiation over a year.
Why did the yield drop when I ran the shading analysis?
When the analysis covers every panel, the loss per panel is deducted from the estimated yield. Without a shading analysis, the panels are treated as unshaded.
Read next
- Shading losses on solar panelsNear shading, horizon and rows – and why a partly shaded panel loses more than its share.
- Ritwerk vs SolarEdge DesignerTwo web tools – one built for SolarEdge systems, the other independent of the manufacturers.
- Ritwerk vs HelioScopeA tool for commercial solar with storage versus a solar designer for houses, halls and loads.
- Energy and batteryConsumption profile or hourly readings, PVGIS 5.3, an hour-by-hour simulation and the battery sized against hourly prices.
Try it on a real roof.
The designer opens in your browser, with no account. Search for an address and start drawing.