Feature · Energy
Yield against consumption, hour by hour.
The designer works through all 8,760 hours of the year: the solar yield for this particular roof against the building’s consumption. From that come self-consumption, export and the value of a battery – as estimates, with the source stated.
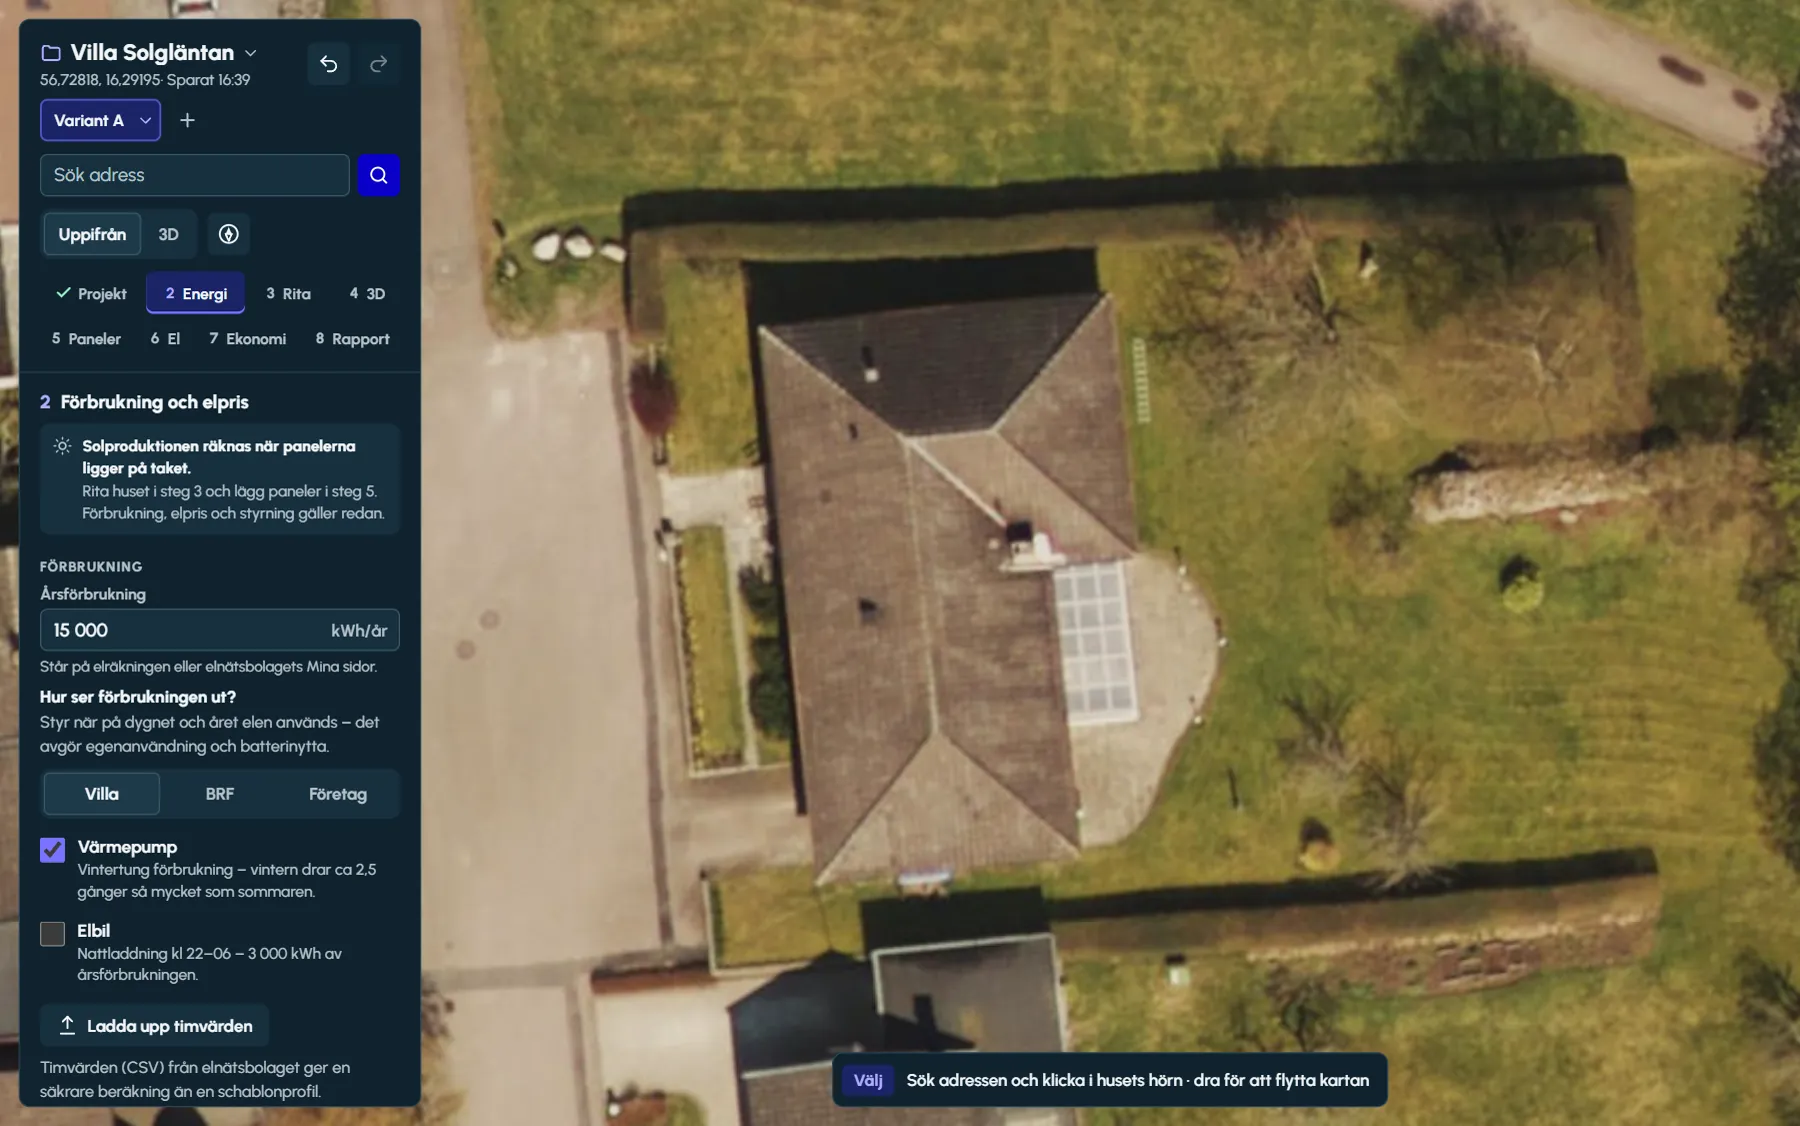
Consumption: profile or hourly readings
In step 2 you enter the annual consumption and choose the customer type. A house has morning and evening peaks and slightly higher consumption in winter. A housing association has building electricity around the clock with an evening peak, and a business uses most on weekdays from 07:00 to 17:00.
For a house there are two options. Heat pump makes winter roughly 2.5 times as heavy as summer, and EV adds charging from 22:00 to 06:00 every night – the charging is included in the annual consumption. If the customer has hourly readings from their grid operator, you upload the file, and it then drives the whole profile.
The hourly readings file
- CSV or text file separated by semicolon, comma or tab. Header rows and metadata at the top are skipped.
- Quarter-hourly values are summed to hours. Values in Wh, MWh or kW are converted when the unit is given in the header.
- Swedish local time with daylight saving is converted to standard time, and hour-ending timestamps are moved to the start of the period.
- At least one week is needed, ideally a whole year. Gaps are filled with the same hour from the week before, and if the file spans several years the latest twelve months are used.
- Excel and PDF files are not read – save the file as CSV first.
Yield: simulation with the PVGIS weather year
Once the panels are on the roof, the designer fetches a typical meteorological year (TMY) for the site from PVGIS 5.3, the European Commission’s solar service, and the horizon from the PVGIS terrain model. Yield is then simulated hour by hour for each panel orientation.
The simulation follows a loss chain. Irradiance is transposed to the plane of the panel with the Perez model. Horizon, shading, reflection in the glass, soiling and snow are included, as are module temperature from air temperature and wind using the Faiman model, mismatch per string, cables, the inverter’s efficiency curve with clipping at rated power, and degradation. Each step becomes a line in the loss waterfall in step 8, in kWh and per cent.
Alongside it is what PVGIS’s own annual calculation gives for the same panels, and the difference in per cent. If the weather year cannot be fetched, the designer uses PVGIS monthly values per orientation, and without PVGIS a rule-of-thumb value of 950 kWh per kWp, adjusted for orientation and tilt. The source is shown next to the figures.
The assumptions can be adjusted
- Ground reflectance (albedo), with a higher value when the ground is covered in snow.
- Soiling, snow loss and cable losses on the DC and AC sides.
- Light-induced degradation in the first year, ageing per year after that and which operating year is simulated.
- The changes are saved in the design and the simulation is recalculated.
Self-consumption and export
Yield is set against consumption hour by hour. Self-consumption is the share of the solar energy used in the building, directly or via the battery. Self-sufficiency is the share of consumption covered by solar. The rest is exported and imported electricity respectively.
Step 8 shows the result per year, month by month and as a typical day in July and in January. Imported electricity is valued with the energy price, grid fee, energy tax and VAT, exported electricity with the spot price and the grid benefit payment – using the prices you enter in step 2.
Battery sizing: the size where the next module stops adding much
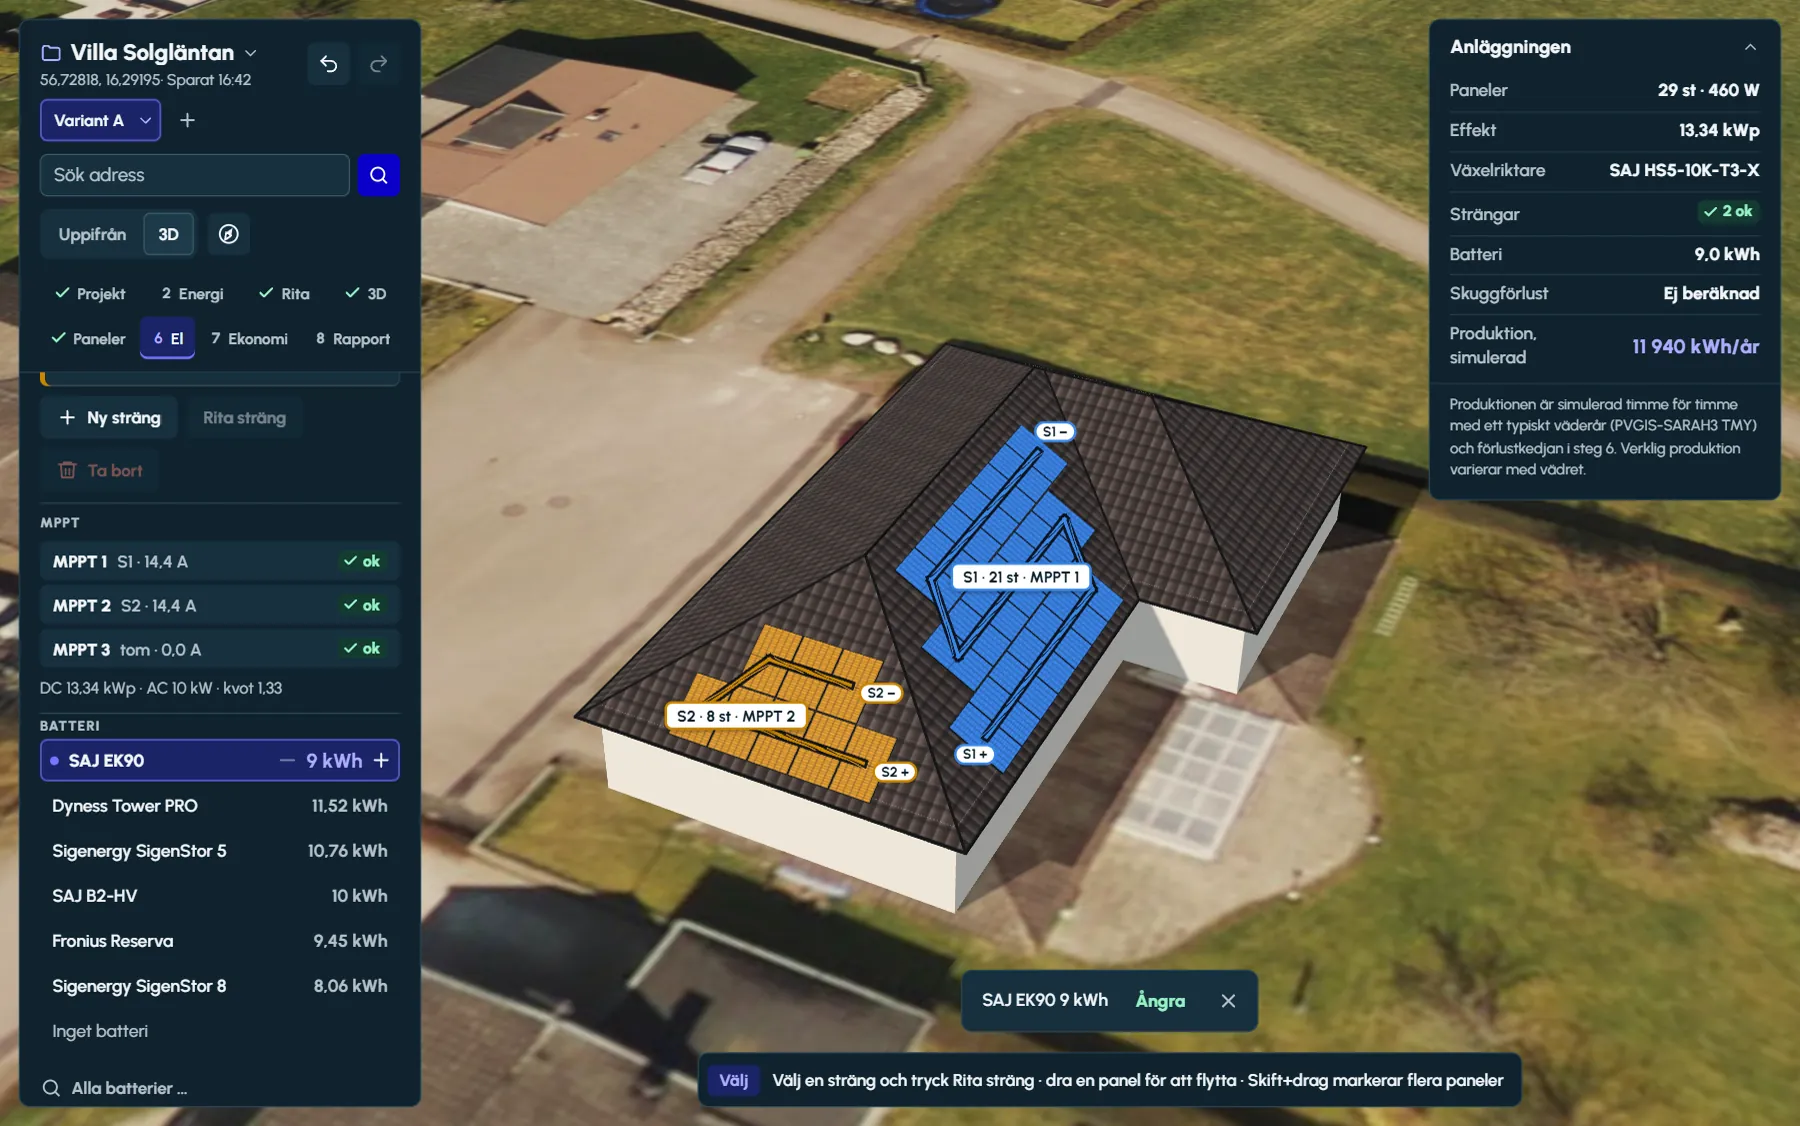
In step 6 the designer tries every battery whose pairing with the inverter series is confirmed, in every module count that fits the inverter’s battery input. Each size is simulated against the building’s yield and consumption.
The suggestion is the size at the knee: the last one before an extra kWh adds less than half as much as the first. The menu shows only name and kWh, and the selected battery is changed with minus and plus. If the battery needs a different inverter, the inverter is swapped in the same step, and Ctrl+Z undoes both.
- The whole register of 35 batteries is available under All batteries.
- The battery’s usable capacity and power come from the catalogue, limited by the inverter’s power.
- Step 8 shows the estimated extra savings per year for different battery sizes.
Control by hourly price
The battery can be controlled in two ways. Solar only charges the battery with surplus solar energy and discharges it when the building needs power. By hourly price, the default, plans each day with a 48-hour horizon: the battery saves solar energy for expensive hours and can charge from the grid when electricity is cheap. Surplus solar energy that the plan does not use is charged anyway.
The hourly prices are the 2025 spot prices for Sweden’s four bidding zones SE1–SE4 (Nord Pool day-ahead), built into the designer; prices for other markets are not included. The bidding zone follows the address and can be changed. The purchase price follows the spot price around the average price you have entered, so that the annual average stays the same – the value of the control comes only from the differences between hours.
The value of the panels without a battery is calculated on the average prices, so that designs with and without a battery can be compared.
Yield, savings and the value of the battery are estimates. The weather, the electricity price and how the building uses electricity determine the outcome.
Questions and answers
Questions and answers
Where do the yield figures come from?
From an hour-by-hour simulation with a typical meteorological year from PVGIS 5.3, the European Commission’s solar service, and the horizon from the PVGIS terrain model. PVGIS’s own annual calculation is shown for comparison. If PVGIS cannot be reached, the designer uses a rule-of-thumb value of 950 kWh per kWp and says so.
Which files can be used for hourly readings?
CSV or text files separated by semicolon, comma or tab, with a timestamp and consumption on each row. Quarter-hourly values are summed to hours. Save an Excel file as CSV first.
How does Ritwerk choose the battery size?
The designer simulates every battery that suits the inverter, in every module count, and suggests the size where an extra kWh adds less than half as much as the first. You can choose a different size with minus and plus.
Which bidding zones have hourly prices?
Sweden’s four bidding zones SE1–SE4, with the 2025 spot prices hour by hour. Prices for other markets are not built in. The bidding zone follows the address and can be changed in step 2.
Does the battery charge from the grid?
With By hourly price control it can, when electricity is cheap and more expensive hours lie ahead. With Solar only, the battery charges only from surplus solar energy.
Read next
- Battery sizing for solar PVSelf-consumption, hourly readings, the knee where the next kWh adds less, hourly prices and backup power.
- Ritwerk vs PV*SOL premiumA Windows program with a large database versus a browser-based solar designer with the loads in the drawing.
- EconomicsThe price to the customer on one line, savings per year and payback period – the same figures in the comparison and the PDF.
- Shading analysis per panelSun path, sky view and shading loss per panel – with dormers, chimneys, trees and walls.
Try it on a real roof.
The designer opens in your browser, with no account. Search for an address and start drawing.