Feature · Report
A report you can hand over.
The PDF is built from the design: the customer’s own house in 3D, the panels on the plan drawing and the figures behind the proposal. You choose the scope – short, standard or full.
How the report is created
Open PDF report
In step 8, or from the project menu next to the project name.
Choose the scope
Short, Standard or Full. Under Customise you tick the sections and the key figures on the cover one by one.
Choose variants
With two or more variants selected, the report opens with a side-by-side comparison.
Create PDF
The report opens in a new window with the print dialog. Choose Save as PDF. Your choice is saved in the project for next time.
Three levels
- Short
- Cover, layout and economics – two to three pages
- Standard
- Adds products, shading, simulation and losses, battery size and the sources
- Full
- Everything: also strings and wiring diagram, daily profile, mounting, bill of materials and snow and wind loads
The cover and the layout
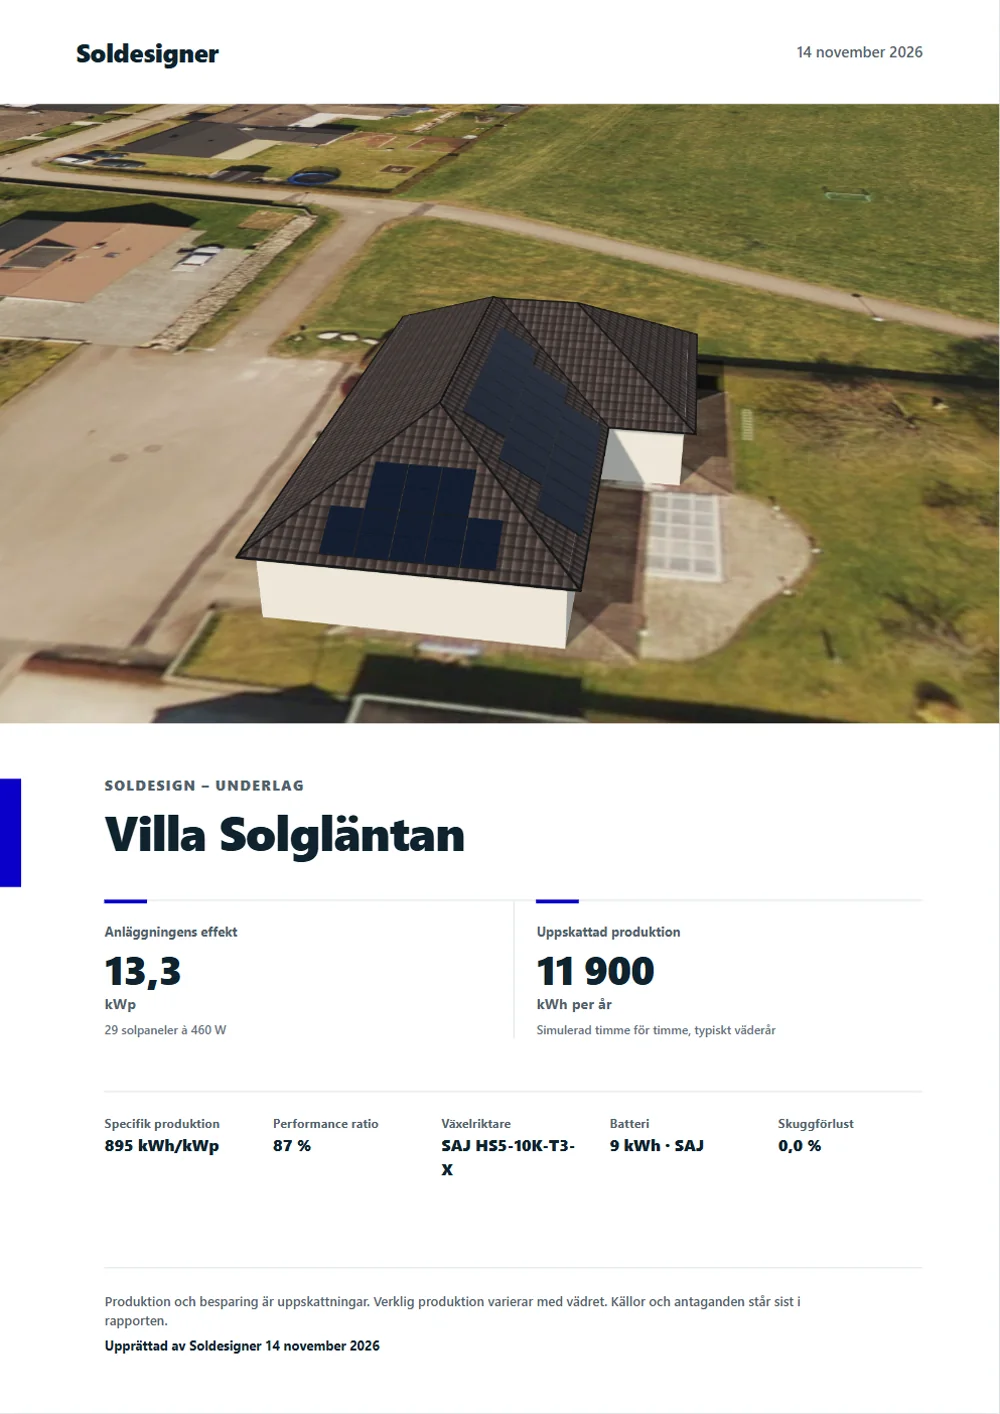
The cover shows the project name, address and date, a 3D view of the house with the panels and up to four key figures in large type: system size, estimated yield, savings and payback period. Below them are the inverter, the battery and any other fields you have chosen, and a line saying that yield and savings are estimates.
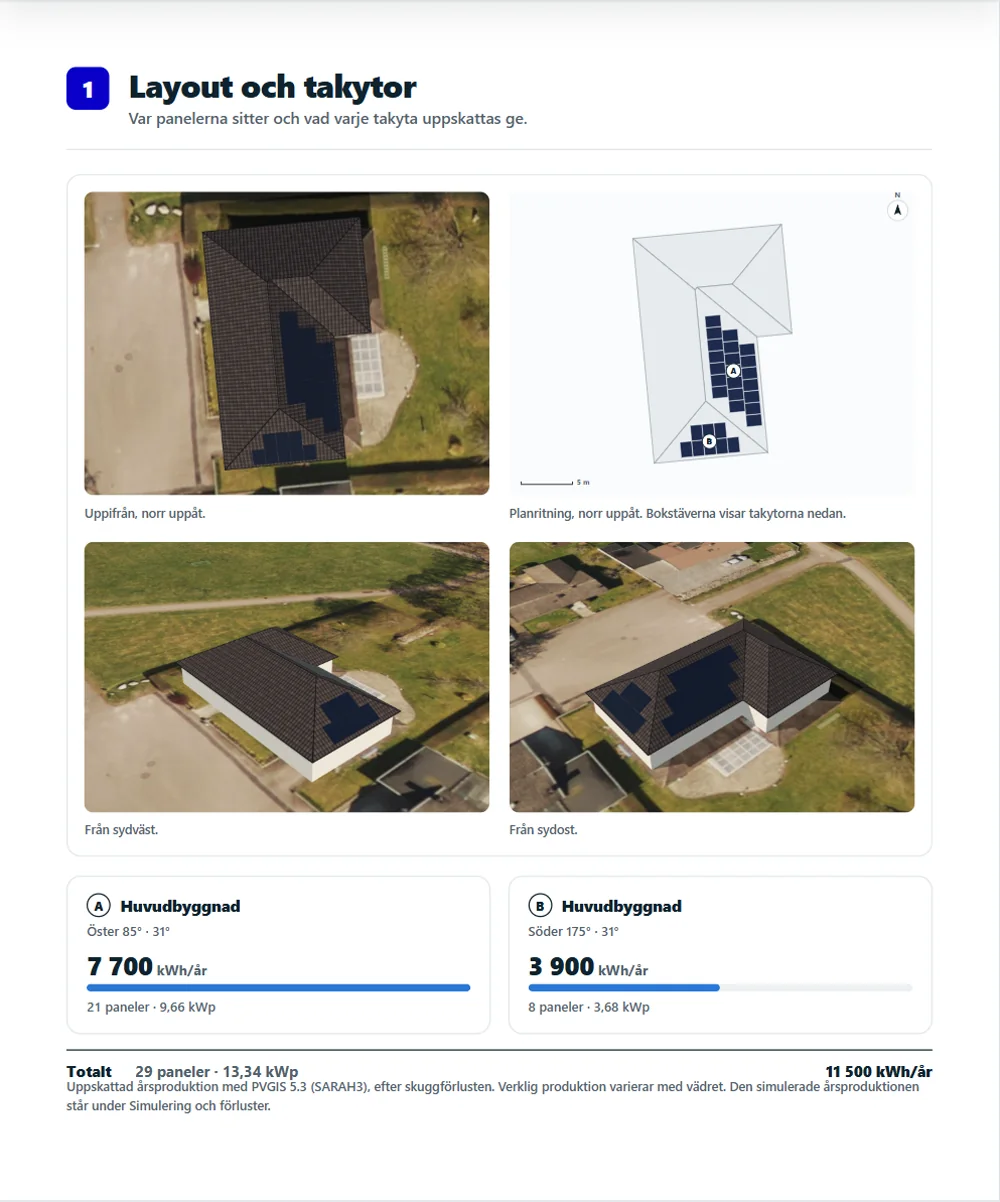
The Layout and roof faces section has the plan drawing with north up and a letter per roof face, the house from above and two 3D views from the south-west and the south-east. Each roof face gets a card with orientation, pitch, panel count, power and estimated yield.
The system, the shading and the simulation
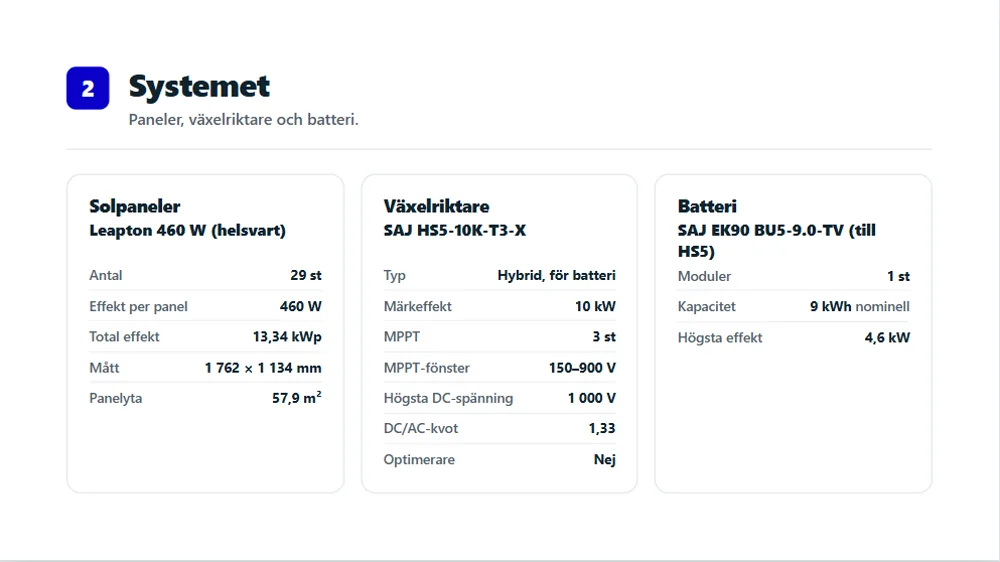
The System section describes panels, inverter and battery with data from the datasheets: power, dimensions, MPPT window, maximum DC voltage, DC/AC ratio, capacity and power. Preliminary datasheet values are marked with an asterisk and should be checked before ordering.
The Shading section shows the estimated shading loss, the most shaded panel and the loss per roof face, with the panels in the colour scale on the plan drawing. Simulation and losses shows annual yield, specific yield and PR, the loss chain as a waterfall from irradiation to energy fed into the grid, month by month, the weather year and the comparison with PVGIS.
Energy and economics
- Savings, payback period, self-consumption and self-sufficiency as key figures.
- Where the solar power goes: the solar power used in the house and exported, and the consumption covered by solar and bought from the grid, in kWh and per cent.
- Month by month: solar yield and consumption.
- Battery size: estimated extra savings per year for different sizes.
- A typical day in July and in January, at the full level.
- The section is included once the consumption is entered in step 2.
Full level: strings, mounting and loads
Strings and wiring diagram has a table per string with MPPT, panel count, Voc at −25 °C, Vmp at 70 °C and status, the current per MPPT against the input limit and the string plan with each string in its own colour from plus to minus.
Mounting and bill of materials is included once a mounting system is selected in step 5: the system per roof face and the items with part numbers and quantities following the manufacturer’s installation instructions. Snow and wind loads get a page of their own with the input values, the load per roof face and zone and the fixings with the largest c/c spacing. The calculation is marked as preliminary, and the number of fixings is confirmed in the manufacturer’s calculation software before ordering.
Sources and assumptions
At the end, the report states what the calculations are based on: the weather year and the simulation models, PVGIS or the fixed estimate, shading, voltages, consumption and electricity prices, product data, mounting and loads. At the short level the sources are given in a box.
The report states yield and savings as estimates and gives the source: the simulation with the PVGIS weather year, the PVGIS annual calculation or the fixed estimate. Preliminary product data is marked.
The 3D images are taken from the designer when the PDF is created: the cover, the house from above and two oblique side views, with the panels without shading colours, and – once the shading analysis has been run – an image from the south for the shading section. With several variants, each variant starts on a new page, with the variant’s name and colour in the heading. The footer carries the project name, address, date and page number. When a mounting system is selected, the bill of materials can also be downloaded as CSV in step 8.
Questions and answers
Questions and answers
How do I get the report as a PDF?
Press Create PDF in the report dialog. The report opens in a new window with the print dialog, where you choose Save as PDF. The browser needs to allow pop-up windows for the site.
Can I choose what goes in?
Yes. Choose Short, Standard or Full, or tick the sections and the key figures on the cover under Customise. Your choice is saved in the project.
Are snow and wind loads included in the report?
Yes, at the full level once the ground snow load and reference wind speed have been entered. They get a page of their own with the load per roof face and zone. The fixings are calculated once a mounting system is selected, and the calculation is marked as preliminary.
Can the report compare several options?
Yes. Select two or more variants in the dialog, and the report opens with a side-by-side comparison and then covers each variant separately.
Why was a section left out?
Sections without input are left out. Energy and economics needs the consumption in step 2, the bill of materials needs a mounting system and the comparison needs two selected variants. The dialog tells you what is missing.
Read next
- Snow and wind loads on solar panelsFrom ground snow load and reference wind speed to load per m², wind zones and the c/c spacing of fixings.
- Ritwerk vs PV*SOL premiumA Windows program with a large database versus a browser-based solar designer with the loads in the drawing.
- Ritwerk vs SolarEdge DesignerTwo web tools – one built for SolarEdge systems, the other independent of the manufacturers.
- EconomicsThe price to the customer on one line, savings per year and payback period – the same figures in the comparison and the PDF.
Try it on a real roof.
The designer opens in your browser, with no account. Search for an address and start drawing.